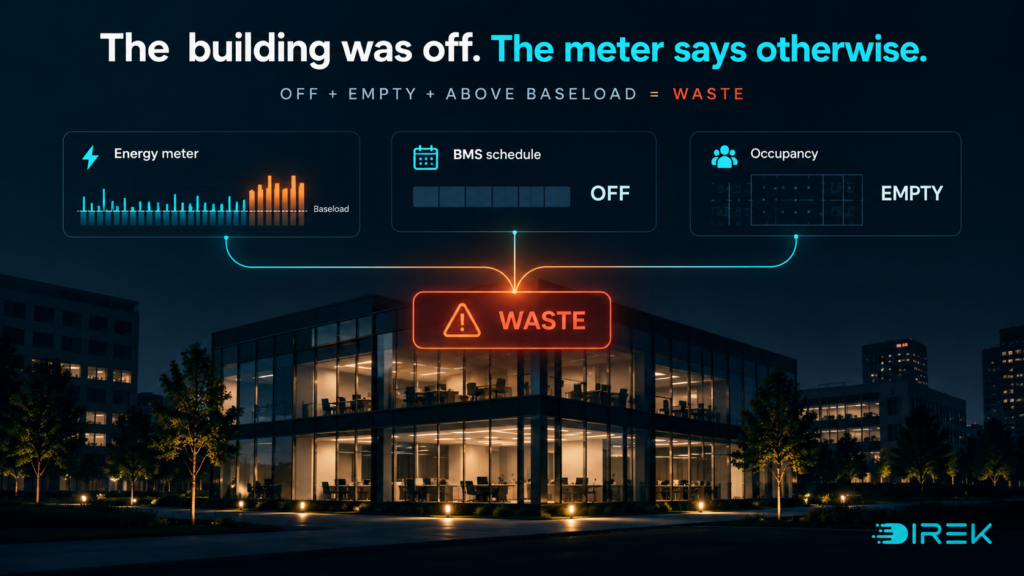
An air handling unit starts at 04:30 for a cleaning shift that no longer exists.
A chiller runs through a bank holiday because the calendar was never updated.
A temporary override becomes permanent.
An optimum-start routine quietly moves earlier over winter and never moves back.
On the BMS schedule, everything can look correct.
The half-hourly meter tells a different story.
That distinction matters because out-of-hours energy waste is not fundamentally a scheduling problem.
It is a measured event: energy being consumed above legitimate baseload when the building is supposed to be unoccupied and there is no operational reason for the additional load.
And you can often find it using data your estate already has.
What is out-of-hours energy waste?
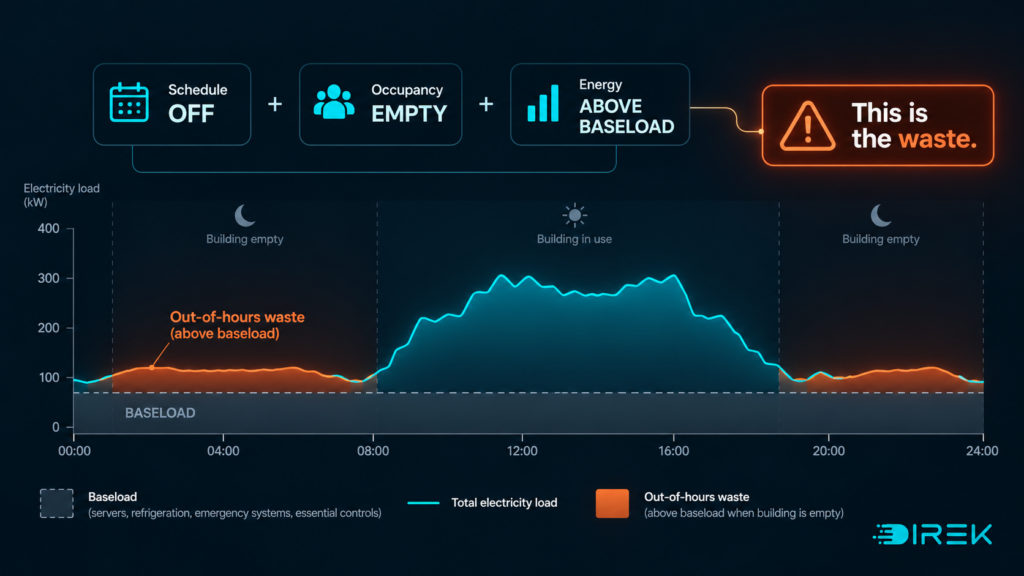
Out-of-hours energy waste is the energy a building consumes above its legitimate baseload when there is no occupancy or operational reason for that additional demand.
First, separate baseload from waste.
A building does not need to reach zero consumption when it is empty.
Servers may need to run. Refrigeration continues. Emergency systems, controllers and other essential loads remain active.
Those loads form the building’s legitimate baseload.
The problem is what sits above that baseload when there is no corresponding demand.
For practical analysis, we define an out-of-hours waste event as a time interval where:
Schedule says OFF + Occupancy says EMPTY + Consumption is ABOVE BASELOAD
That half-hour cell is the analytical unit that matters.
Not simply night-time consumption.
Not an arbitrary percentage of daytime demand.
And not what the BMS schedule says should have happened.
What about out-of-hours energy ratios?
CIBSE Guide F provides useful screening context.
For buildings occupied around 8–12 hours per day, night-time consumption should be minimal. For continuously occupied buildings, night load may legitimately represent around 10–40% of typical daytime load, with higher levels warranting investigation.
But this should be treated as a screening flag, not the definition of waste.
A building can have a seemingly acceptable night-to-day consumption ratio and still waste significant energy across weekends, public holidays and empty periods.
The stronger test is:
Was the additional consumption justified by actual building demand?
Why a BMS schedule review can miss the problem
Most facilities teams recognise the causes:
- Manual overrides: a Friday afternoon boost is never cancelled.
- Holiday-calendar errors: the normal weekday profile runs through a public holiday.
- Setback failures: occupied setpoints return after a controller restart or firmware update.
- Shared zoning: one 24/7 tenant keeps an entire shared AHU running.
- Optimum-start creep: plant starts progressively earlier than necessary.
- False occupancy: lighting or controls respond to cleaning, security patrols or sensor behaviour rather than meaningful demand.
These problems are not necessarily visible in a quarterly BMS schedule review.
A schedule review answers:
What is the system programmed to do?
It does not necessarily answer:
What actually happened?
Overrides, control failures and operational drift leave their evidence in plant-status and meter data.
That is why the schedule on screen and the schedule that actually ran should be treated as two different things.
The minimum data needed to find out-of-hours energy waste
You do not need to install submeters throughout the estate before starting.
For many commercial buildings, three existing data streams are enough.
1. Half-hourly energy data
Half-hourly electricity and gas consumption provide the ground truth of what the building actually consumed.
Larger UK commercial supplies have commonly been settled half-hourly for years, including former profile classes 05–08 under P272/P322 arrangements, while Market-wide Half-Hourly Settlement is extending half-hourly settlement more broadly.
AMR data is often already available through the supplier, meter operator or existing energy-management platform.
Submetering at AHU, chiller or lighting-panel level can sharpen the diagnosis.
It is useful, but it is not a prerequisite for finding the pattern.
2. BMS schedule and plant-status data
You want more than the schedule table.
Where available, extract:
- plant on/off status
- schedule state
- setpoints
- override flags
- optimum-start behaviour
The important comparison is between what should have run and what actually ran.
3. One occupancy signal
This does not necessarily require dedicated occupancy sensors.
Depending on the building, you may already have:
- access-control data
- room bookings
- university timetables
- lettings schedules
- desk or room occupancy data
- footfall counts
This third data stream prevents a critical mistake.
A building consuming energy at 20:00 is not necessarily wasting it if 300 people are attending an evening event.
Occupancy gives energy consumption context.
For more on connecting actual space demand to building operation, see how occupancy data can be integrated with BMS operation.
Overlay the three streams: meter, BMS and occupancy
Now align the three datasets into matching half-hour intervals.
For every interval, ask:
- Was the building scheduled to operate?
- Was anybody actually using it?
- How much energy did it consume?
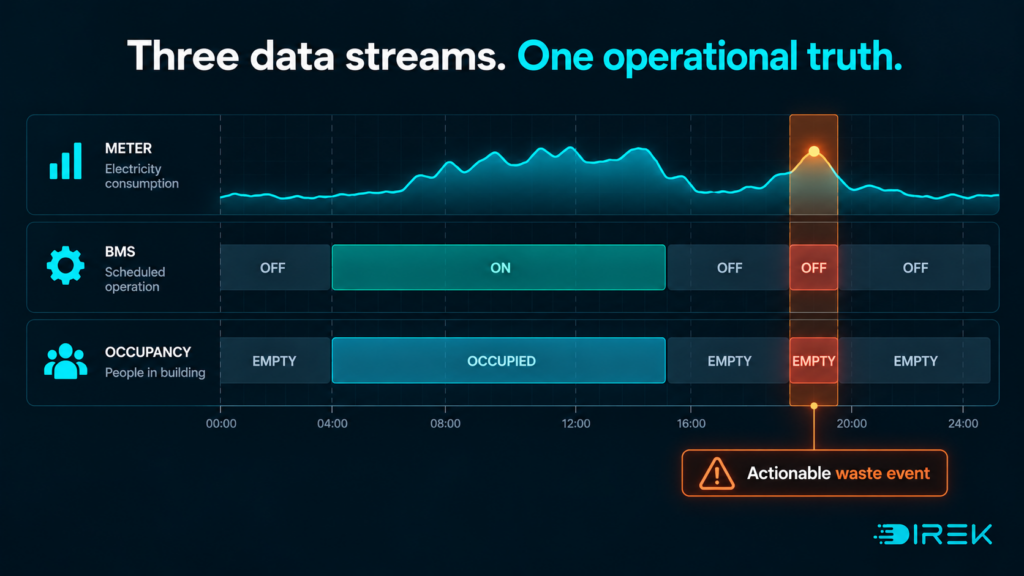
The interesting cells are those where:
Scheduled OFF × Occupancy EMPTY × Consumption ABOVE BASELOAD
That is where investigation starts.
Run the overlay across at least four to six representative weeks and patterns begin to emerge.
An AHU consistently starts 90 minutes before meaningful occupancy.
A particular floor remains conditioned every Friday despite very low attendance.
A sports hall continues its old weekend schedule months after the booking pattern changed.
A shared riser forces substantially more space to operate than the occupied zone requires.
These are much more actionable findings than simply reporting:
“Your out-of-hours consumption is high.”
How to establish a building’s baseload
This step matters because not all out-of-hours energy consumption is waste.
Do not use a generic night-time average as your baseload.
Instead, identify genuinely empty periods and use the lowest-load intervals to estimate the irreducible consumption of that building.
One practical approach is to use the lowest 5% of confirmed-unoccupied intervals across the analysis period.
For example, confirmed-empty periods between 03:00 and 04:00 on weekends or holidays may provide useful evidence.
That baseload can include:
- servers
- refrigeration
- emergency systems
- essential controls
- other legitimate continuous loads
These loads are therefore not counted as waste.
For each flagged half-hour interval:
Wasted kWh = measured kWh − expected baseload kWh
Only then should those intervals be aggregated into daily, monthly and annual estimates.
This also resolves a common source of confusion.
An out-of-hours-to-daytime load ratio is a diagnostic indicator.
The share of annual consumption identified as avoidable out-of-hours load is an output of the analysis.
They are not the same metric.
How to quantify the financial impact of out-of-hours energy waste
Once the wasted intervals have been isolated, translate them into money and carbon.
Financial impact
Financial impact = wasted kWh × applicable tariff
For a commercial building of this scale, a reasonable illustration might use an all-in electricity rate in the mid-20s p/kWh, with the actual calculation using the site’s own tariff and, where relevant, its half-hourly time-of-use rates.
Do not hide tariff assumptions.
Show them.
Carbon impact
Carbon impact = wasted kWh × applicable electricity emissions factor
For SECR and similar reporting, use the relevant DESNZ conversion factor for the reporting year rather than carrying forward an older factor.
Where the objective is operational optimisation rather than annual reporting, time-specific grid-carbon data can provide a more accurate picture because grid carbon intensity changes throughout the day.
The principle is simple:
Calculate from the actual wasted interval, not from a generic annual assumption.
Worked example: a 10,000 m² commercial office
Consider a 10,000 m² office.
Assume annual electricity consumption of:
150 kWh/m²/year
That gives:
1.5 GWh/year
Now suppose the meter, BMS and occupancy overlay identifies 300,000 kWh/year of consumption above baseload during confirmed-unoccupied periods.
At 25p/kWh:
£75,000/year
At 30p/kWh:
£90,000/year
The important point is not that every 10,000 m² office wastes £75,000–£90,000.
It does not.
The point is that once waste is identified from individual half-hour events, the annual financial exposure becomes measurable.
No generic “30% building energy waste” assumption is required.
How to correct BMS schedule drift
Finding the problem once is useful.
Preventing it from returning is more valuable.
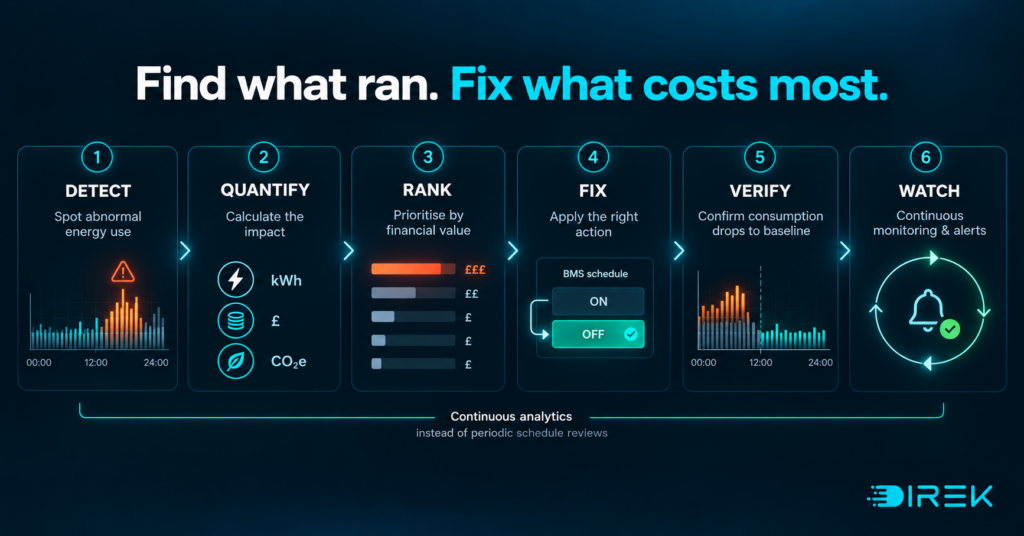
A practical operating loop looks like this:
- Baseline
Overlay four to six weeks of meter, BMS and occupancy data. - Rank by £ and kgCO₂e
Do not start with the easiest anomaly. Start with the largest financial and carbon wedge. - Find the cause
Check the override history, holiday calendar, setback logic, optimum-start behaviour, zoning dependencies and sensor status. - Correct it
Cancel the override, adjust the schedule, update the calendar, re-tune optimum start or change the zoning logic where possible. - Re-measure
Do not assume the intervention worked. Check the following weeks against the baseline. - Keep watching
If plant operates outside schedule, the space is empty and consumption rises materially above baseload, flag it.
This final step changes the process from a periodic energy audit into continuous operational management.
Real-world example: finding energy waste without replacing the BMS
At a UK secondary school, continuous energy analysis identified £10,239 of out-of-hours electricity waste over nine months, representing 18.1% of electricity spend during the analysed period.
The more useful insight was not the percentage.
It was what the operational data revealed.
Plant was starting 1 hour 45 minutes too early.
Shutdown was overrunning by 3 hours 15 minutes.
These are not abstract efficiency scores.
They are operational instructions.
The initial corrective actions did not require a major retrofit or BMS replacement.
They involved schedule corrections, timer checks and changes to shutdown behaviour.
That is what operational energy intelligence should produce:
Here is when the waste happened.
Here is what caused it.
Here is what it cost.
Here is what to change.
See the full DIREK energy-waste reduction case study.
The schedule on screen is not the schedule that ran
Out-of-hours energy waste does not persist because facilities teams do not understand scheduling.
It persists because buildings change.
Occupancy changes.
Tenants change.
Timetables change.
Cleaning contracts change.
Seasonal controls change.
Overrides accumulate.
Optimum-start algorithms drift.
And a configuration that was correct six months ago can quietly become expensive today.
That is why the more useful question is not:
“Is the BMS schedule correct?”
It is:
“When the building was empty, what actually ran?”
You can start answering that without replacing the BMS, installing submeters everywhere or commissioning another one-off audit.
Start with three things you may already have:
- Half-hourly meter data
- BMS plant-status data
- One occupancy signal
Overlay them.
Then find every half-hour where the building was supposed to be off, was actually empty, but was still consuming above legitimate baseload.
That is where the waste is.
What is EnergyLens?
DIREK’s EnergyLens connects energy, BMS and occupancy data to identify operational mismatches continuously rather than waiting for the next manual review.
The objective is not another energy dashboard.
It is a ranked operational answer:
What ran when it should not have, what did it cost, and what should we change first?
Explore DIREK’s energy-efficiency and operational energy intelligence capabilities.
Frequently asked questions about out-of-hours energy waste
What is out-of-hours energy waste?
Out-of-hours energy waste is consumption above legitimate building baseload during periods when the building is unoccupied and there is no operational reason for the additional load.
How can you detect out-of-hours energy waste?
The most practical method is to overlay half-hourly meter data with BMS plant-status or schedule data and one occupancy signal. The key intervals are those where the schedule says off, occupancy says empty and consumption remains above expected baseload.
Do you need occupancy sensors to find energy waste?
No. An occupancy signal can come from access-control data, bookings, timetables, lettings schedules, footfall systems or occupancy sensors. The objective is to establish whether there was legitimate demand during the period being analysed.
Do you need submetering?
No. Whole-building half-hourly meter data can be enough to identify the pattern. Submetering helps isolate the responsible plant or circuit more quickly, but it is not required to begin analysis.
Why can a BMS schedule review miss energy waste?
A BMS schedule review shows what the system is programmed to do. Manual overrides, optimum-start drift, controller failures and other operational events can cause the building to behave differently. Meter and plant-status data reveal what actually happened.
How should out-of-hours waste be prioritised?
Prioritise anomalies by financial cost and carbon impact rather than simply by ease of correction. This helps facilities and energy teams address the largest operational opportunities first.