Office Occupancy Monitoring: Why Average Occupancy Is Not Enough
Office occupancy monitoring is increasingly important for hybrid workplaces, but many organisations still rely on average occupancy as their main space-management KPI. That single number can make an office look half-empty while employees struggle for desks, meeting rooms and services on the busiest days. The problem is not the occupancy data itself. It is using one average to answer operational questions that depend on when, where and how people use the building.
Recent workplace data makes the problem increasingly visible. CBRE’s 2026 global workplace research reports average building utilisation of 53%, while average peak utilisation reaches 80%. HubStar’s Hybrid Occupancy Index puts Tuesday occupancy at 58.6% globally in 2025, compared with 34.5% on Friday. XY Sense reports global utilisation reaching approximately 45% by March 2026, with the UK at 55% in its dataset.
Different workplace analytics providers define occupancy and utilisation differently, so these figures should not be treated as directly interchangeable benchmarks. However, they point to the same operational pattern: hybrid office demand is not evenly distributed across the working week.
This is why effective office occupancy monitoring needs to expose the distribution underneath the average rather than simply producing another utilisation percentage.
Why office occupancy monitoring needs more than an average
The modern hybrid office does not experience one utilisation rate.
It experiences Tuesday morning, Wednesday lunchtime and Friday afternoon.
Remit Consulting’s ReTurn research found UK office occupancy stabilising above 40%, with late January 2026 reaching 44.1%. HubStar found Tuesday to be the busiest day globally at 58.6% occupancy, while Friday averaged 34.5%. CBRE’s research also identifies Tuesday as the highest-attendance day for a substantial proportion of organisations.
That difference between the weekly average and the peak is one of the most important issues for workplace and facilities management.
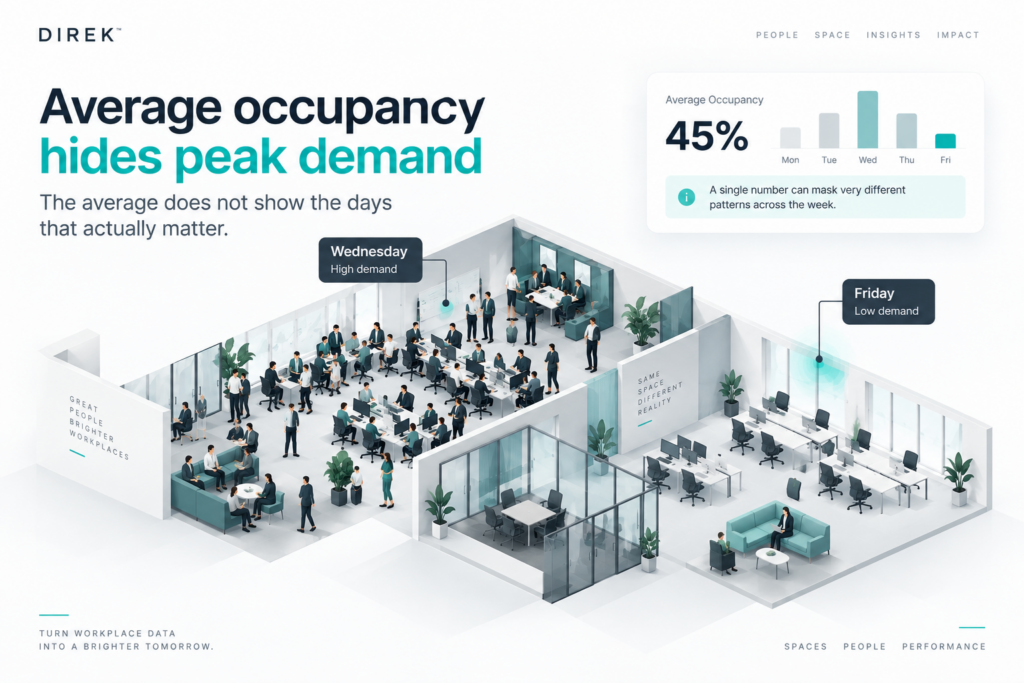
A building can therefore appear underused when viewed across the whole week while individual floors, rooms or services experience significant pressure for a few critical hours.
CBRE’s 2026 UK Office Occupier Benchmark Report makes an important distinction: organisations may determine which days employees attend, but the peak ultimately influences how much space is required.
For facilities teams, the same principle extends beyond real estate. Peak demand influences where cleaning, ventilation, catering, front-of-house services and meeting-room capacity are actually required.
What office occupancy monitoring reveals about hybrid working
This pattern is visible in DIREK’s own workplace occupancy data.
In a DIREK portfolio space optimisation case study, a major UK construction and built-environment company needed to compare three offices in London, Manchester and Leatherhead ahead of major property decisions.
The portfolio contained 929 seats and showed aggregate occupancy of approximately 24%.
Viewed as a single number, 24% might suggest that the estate simply contained too much space.
The underlying occupancy patterns told a more useful story.
- Leatherhead: 617 seats with approximately 18% occupancy. Attendance fell from 188 people on Tuesday to 90 on Friday.
- London: 164 seats with approximately 41% occupancy, while peak desk use exceeded 95%.
- Manchester: attendance increased by 34% quarter-on-quarter, showing a different trajectory from Leatherhead.
- Meeting rooms: peak utilisation averaged only 24.5% across the portfolio.
- Leatherhead call booths: utilisation reached 49.3%, revealing demand for a space type that the headline building average could not expose.
The average was not necessarily wrong. It simply did not contain enough information to answer the operational and property questions.
The occupancy data instead supported a more useful decision framework: which locations should be retained, which spaces should be reconfigured and where consolidation or exit should be considered.
How occupancy data improves facilities management decisions
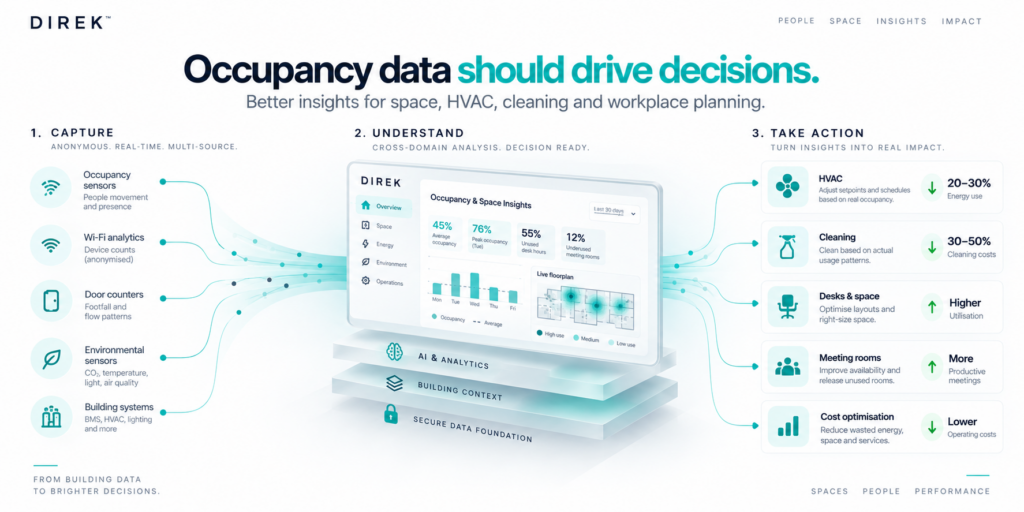
Occupancy monitoring becomes substantially more valuable when the data is connected to an operational decision rather than used simply to populate another dashboard. 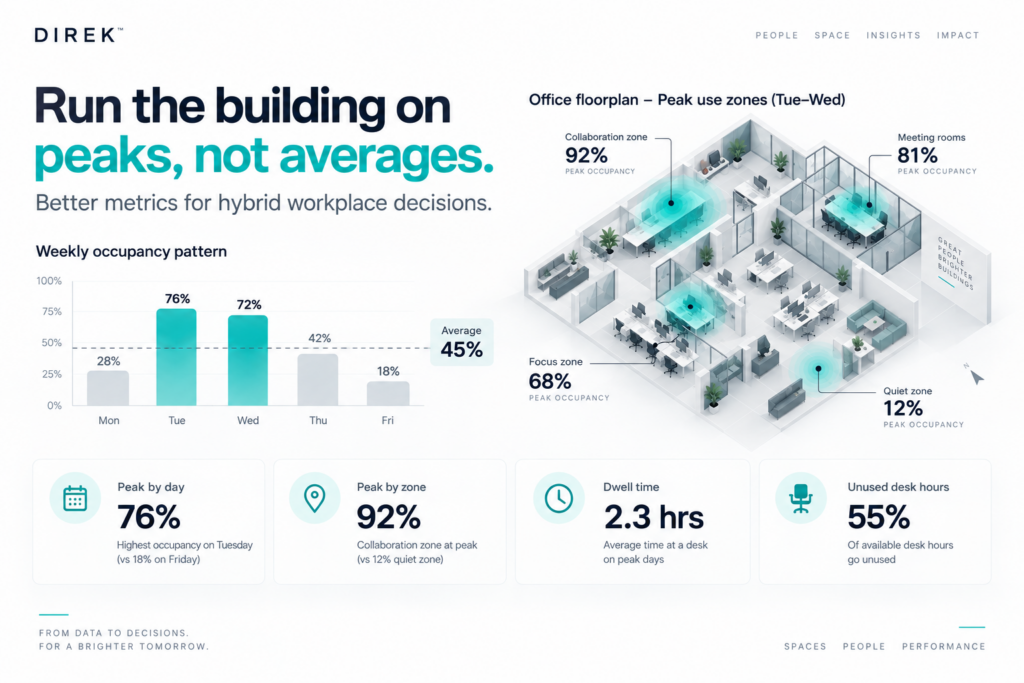
1. Occupancy monitoring and HVAC schedules
Running HVAC according to a fixed five-day schedule can mean conditioning areas that are lightly occupied on Friday. Running services according to a weekly average can create the opposite problem if a space experiences substantially higher demand on Tuesday or Wednesday.
The useful question is therefore not simply:
What is our average occupancy?
It is:
Which zones become occupied, at what time, for how long, and what building services continue running when that demand disappears?
This is where occupancy-led space optimisation becomes more useful than an isolated utilisation percentage. Workplace occupancy patterns can be considered alongside wider operational factors such as HVAC, energy use, cleaning requirements and property costs.
2. Occupancy data and cleaning schedules
A fixed cleaning specification can create the same mismatch.
Tuesday and Wednesday washrooms, kitchens and collaborative spaces may experience much heavier use than Friday, yet the service specification can remain identical across all five days.
Workplace occupancy monitoring gives facilities teams evidence to evaluate cleaning requirements by day, floor and zone rather than relying entirely on a static rota.
3. Occupancy monitoring and desk-sharing ratios
A desk-sharing ratio that looks generous against average office occupancy may become restrictive on the busiest day.
For example, an estate operating at around 45% average utilisation could still experience substantially greater pressure during its Tuesday peak.
The useful ratio is therefore not simply:
Employees ÷ desks.
It should also consider peak simultaneous demand ÷ available desks, together with how frequently that peak occurs.
4. Occupancy analytics and meeting-room supply
Building averages can also produce the wrong diagnosis.
A floor might report relatively low overall occupancy while employees still struggle to find suitable meeting rooms or call booths during peak periods.
That does not automatically mean that the organisation needs more floor space.
It may mean that the mix of space is wrong.
DIREK’s portfolio analysis illustrates this clearly: meeting rooms were relatively underutilised across the portfolio while call booths at Leatherhead showed considerably stronger demand.
The appropriate operational response may therefore be reconfiguration rather than expansion.
Four office occupancy metrics FM teams should track
The alternative to average occupancy is not another single KPI.
Facilities, workplace and estates teams need a small group of occupancy metrics that explain how demand changes over time and across the building.
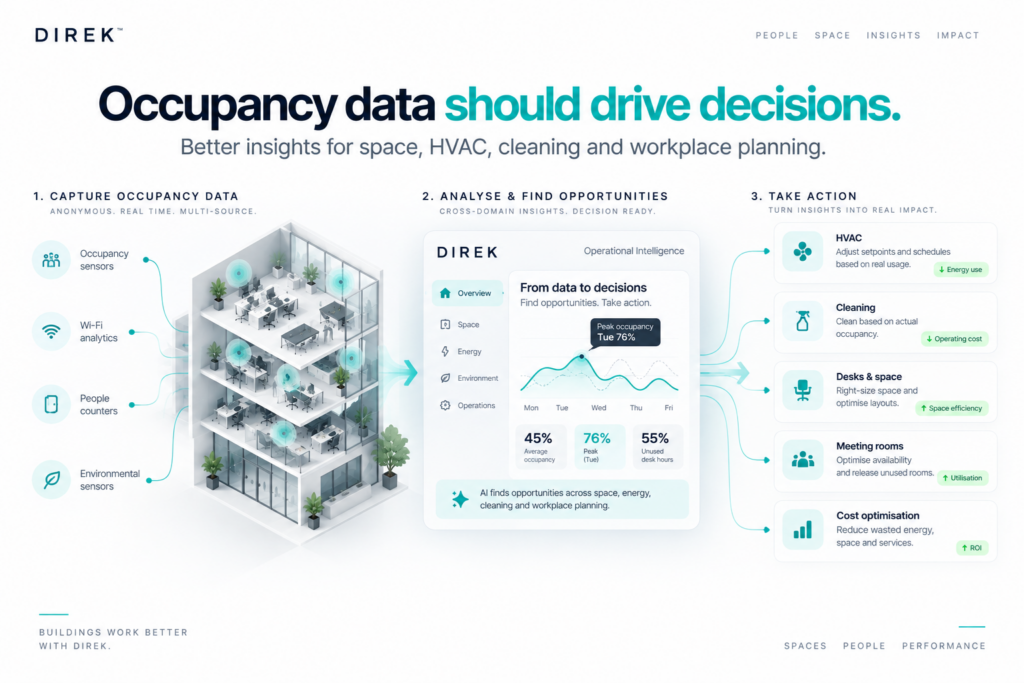
Peak occupancy by day
Which days consistently produce the highest demand?
This supports decisions around staffing, catering, HVAC schedules, cleaning and desk supply.
Peak occupancy by zone
Which floors, rooms and workplace types experience the greatest pressure?
A building can be underutilised overall while particular zones remain capacity-constrained.
Dwell time
How long is a space actually occupied?
A desk used for twenty minutes and a desk occupied for six hours create very different space-management requirements, even if both appear as “used” in a daily utilisation report.
Unused desk hours
How much available desk capacity remains unused, and when?
This gives estates and workplace teams stronger evidence when evaluating consolidation, hot-desking, subletting or future lease requirements.
From occupancy sensors to better space management decisions
Installing occupancy sensors does not automatically improve space management.
The value comes from translating workplace occupancy data into a decision.
DIREK’s SpaceLens and D-XPERT platform use real-time and historical occupancy information to help identify peak periods, underutilised areas and changes in demand across different workplace types.
Rather than presenting occupancy monitoring as another standalone dashboard, the objective is to help workplace and FM teams answer practical questions such as:
- Which floor could we consolidate?
- Do we actually need more meeting rooms?
- Why does Tuesday feel overcrowded when average occupancy is low?
- Which areas are being conditioned when nobody is using them?
- Can we reduce our desk footprint without creating peak-time capacity problems?
- Should cleaning schedules change by day or zone?
That is a more useful objective for office occupancy monitoring than simply producing another percentage on a workplace dashboard.
How to use workplace occupancy data this week
Take the last quarter of your workplace occupancy data and analyse it in four ways:
- Peak occupancy by weekday.
- Peak occupancy by floor or zone.
- Dwell time by space type.
- Unused desk hours by floor.
Then compare those patterns against:
- HVAC operating schedules;
- cleaning schedules;
- meeting-room supply;
- desk-sharing policies;
- lease and service costs.
The differences between what the building’s operating model assumes and how people actually use the workplace are often where the most useful opportunities appear.
Average occupancy still has value. It provides a useful portfolio-level indicator and makes trends easier to compare over time.
But it should not be expected to answer every workplace question.
Employees do not experience average occupancy. They experience the Tuesday morning when there is nowhere suitable to take a call, and the Friday afternoon when half the building may still be serviced as though it were full.
Good office occupancy monitoring exposes both.
Frequently asked questions about office occupancy monitoring
What is office occupancy monitoring?
Office occupancy monitoring measures how many people are using workplace spaces and how that usage changes over time. Depending on the sensing technology and deployment, occupancy data can be analysed at building, floor, room, desk or zone level to support workplace and facilities-management decisions.
What is the difference between occupancy and space utilisation?
Occupancy generally describes the number of people present in a space. Space utilisation describes how much of the available workplace capacity or inventory is actually being used. Exact definitions vary between workplace analytics providers, so organisations should understand how each metric is calculated before comparing different datasets.
Why is peak occupancy more useful than average occupancy?
Peak occupancy shows when and where the workplace experiences its greatest pressure. Average occupancy can hide these periods of high demand, so peak data can be particularly useful for decisions involving desks, meeting rooms, cleaning, catering, HVAC and workplace experience.
What should an office occupancy monitoring system measure?
A useful occupancy monitoring system should go beyond a single percentage. Facilities and workplace teams should be able to understand peak occupancy by day, peak demand by zone, changes in utilisation over time and, where appropriate, dwell time and unused capacity.
Can occupancy monitoring help reduce office costs?
Occupancy data can help identify consistently underused desks, rooms, floors and buildings and provide evidence for consolidation, reconfiguration and changes to facilities services. The financial opportunity depends on the estate, operating model, leases and the decisions that can practically be changed.
Can occupancy monitoring help with hybrid working?
Yes. Hybrid working creates significant variations in demand across different days and space types. Workplace occupancy monitoring can show where those peaks and troughs occur, helping organisations make better-informed decisions about desks, meeting rooms, services and future space requirements.
Sources
CBRE, Global Workplace & Occupancy Insights 2026 and UK Office Occupier Benchmark Report 2026; HubStar, Hybrid Occupancy Index 2025–2026; XY Sense, Q4 2025 + Q1 2026 Workplace Utilization Index; Remit Consulting, ReTurn Report, February 2026; DIREK portfolio space optimisation case study.