
Can You Rebuild Your ESG Reporting Numbers? Why Audit-Ready Evidence Matters
Could you rebuild the number? Pick one figure from your last SECR, S2, NABERS UK, ENERGY STAR or NGER submission — a Scope 2 total, a kWh/m², an emissions intensity — and try to reconstruct it from source data, timestamps, method and assumption. Time yourself. If it takes longer than an hour, or if the trail dead-ends at a spreadsheet owned by someone who’s left, you already know what five regulators on three continents are now independently asking for.
Five regulators, one direction
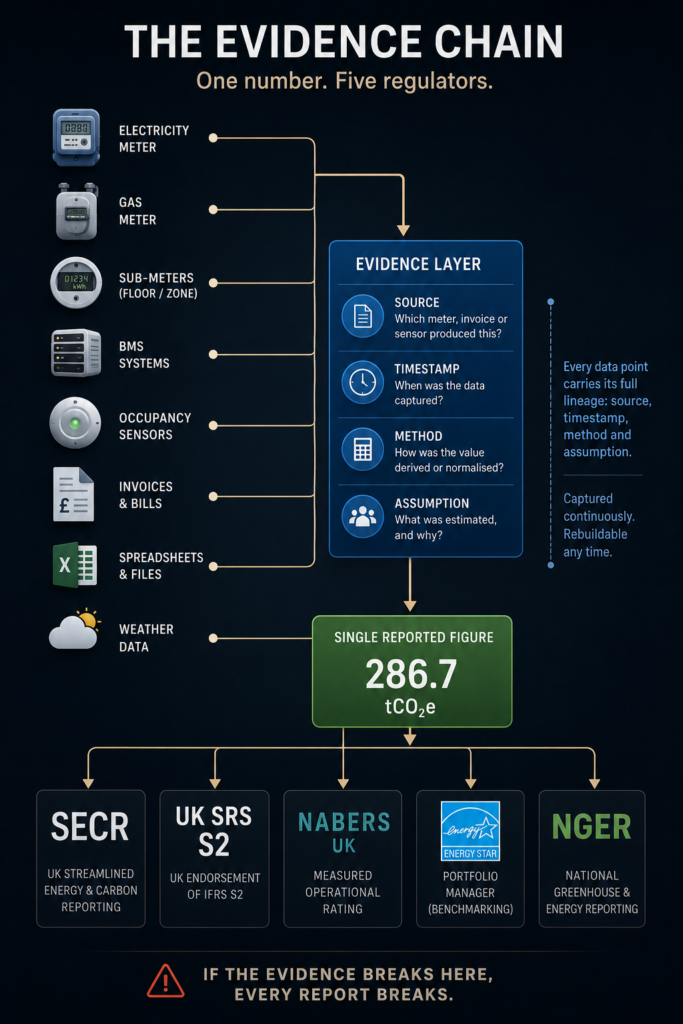
The acronyms make this look like five compliance problems. It isn’t. SECR, the UK’s Streamlined Energy and Carbon Reporting regime, still accepts annual aggregates but sits inside a Companies Act audit chain that now expects methodology to be defensible line by line. UK SRS S2, the UK endorsement of IFRS S2, folds TCFD into a monitoring and assurance regime — the FRC has been explicit that climate figures will move toward the same evidentiary bar as financial ones. NABERS UK refuses design intent entirely: the rating is based on twelve months of measured operational data, meter by meter. ENERGY STAR’s Portfolio Manager applies an eleven-month data-completeness rule that quietly punishes any estate letting metering drift. And in Australia, [NGER data now feeds both the Safeguard Mechanism and mandatory climate disclosure](https://blog.direk.io/scope-3-real-estate-carbon), meaning a single reconciliation error travels across three submissions before anyone catches it.
Strip the acronyms and the demand is identical: stop telling us what you intended, show us what the building actually did, and prove where the figure came from. Narrative out, evidence in.
SECR and UK SRS S2: the audit chain tightens
SECR’s original 2019 framing gave reporters latitude on methodology as long as they disclosed it. That latitude is closing. UK SRS S2, expected to apply to large listed and private companies from 2026 reporting periods, imports IFRS S2’s Appendix B monitoring language — meaning Scope 1 and 2 figures need traceable inputs, not narrative reconciliations. The FRC’s thematic reviews of TCFD-aligned reporting have already flagged ‘insufficient granularity of underlying data’ as the most common weakness. Once S2 assurance lands — limited assurance first, reasonable assurance following — auditors will be testing the figure itself, not the disclosure wrapper around it. Narrative out, evidence in.
NABERS UK and ENERGY STAR: measured operation, no exceptions
NABERS UK, administered by BRE under licence from the New South Wales government, is the clearest expression of the shift. It rates twelve consecutive months of measured energy use, normalised for climate and occupancy. Design ratings are a separate product; they cannot become a NABERS operational rating. If a meter fails for three months, the rating fails. ENERGY STAR Portfolio Manager, the US benchmark used across roughly 25% of American commercial floor space, enforces an eleven-of-twelve-months data-completeness threshold — an estate running on estimated bills for even a quarter is disqualified from certification that year. Both regimes have quietly become the most operationally honest disclosure standards in the world, because they refuse to accept an assumption in place of a reading. Narrative out, evidence in.
NGER: when errors travel
Australia’s National Greenhouse and Energy Reporting scheme was designed as a single-purpose emissions register. It is now the input layer for the Safeguard Mechanism (which sets declining baselines for large emitters) and for the mandatory climate disclosure regime phasing in from 2025. The same NGER figure now appears in three regulatory contexts, each with its own assurance requirement. An overstated activity factor in a spreadsheet cell doesn’t just miscalibrate one submission — it propagates. This is the structural reason regulators everywhere are moving toward source-level evidence: aggregated numbers can no longer be re-derived once they enter downstream systems. Narrative out, evidence in.
Why spreadsheets fail this test structurally
The spreadsheet problem is not a competence problem. Reporting teams are, by and large, careful. The problem is architectural. Annual workbooks are assembled once a year from disparate PDFs, invoice exports and estate-manager estimates. Assumptions are made in the margins and then not documented. Ownership passes from whoever built the model to whoever inherits it, and the reasoning behind a conversion factor or a pro-rata allocation vanishes with the previous analyst. When an assurer asks ‘where did this number come from?’, the honest answer is often ‘from a cell that references another cell that references a value someone typed in eighteen months ago.’ That answer worked under narrative regimes. It will not survive S2 assurance, a NABERS measured rating, or an NGER cross-check.
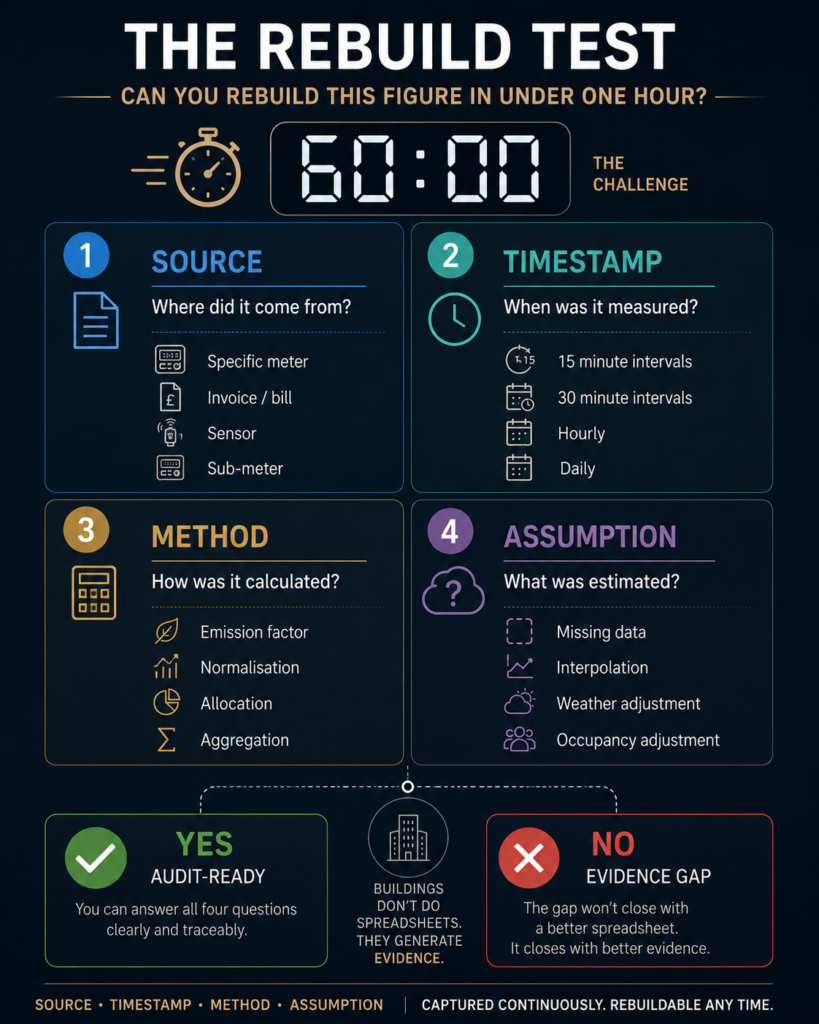
The underlying issue is that spreadsheets store outputs, not evidence. A defensible number needs four things attached to it: the source (which meter, which invoice, which sensor), the timestamp (when the reading was taken, at what interval), the method (how the figure was derived or normalised) and the assumption (what was estimated, and why). All four, for every figure, for every month of the reporting year. That’s what ‘audit-ready’ now means. It’s achievable — one recent operational dataset reached 99.98% completeness across 233,208 kWh of 15-minute interval electricity data, missing only four intervals in a full reporting year — but not through annual reconciliation. It has to be captured as the building runs, not reconstructed afterwards.
The checklist, handed back
Try the rebuild test this week. Pick one figure — a single kWh total, a single tCO₂e line — and see how far you get in an hour against these four questions:
1. Source which specific meter, invoice, sub-meter or sensor produced this? Can you point to it?
2. Timestamp what interval was the data captured at, and is every interval accounted for across the reporting period?
3. Method what conversion factor, allocation rule or normalisation was applied, and where is that documented?
4. Assumption where did you estimate, and is the estimation logic written down somewhere other than someone’s memory?
If you can answer all four in under an hour, your evidence layer is in reasonable shape. If you can’t, the gap won’t close with a better spreadsheet. It closes by capturing evidence continuously — sub-metered by floor or zone, tied to occupancy where relevant — so the figure is rebuildable at any point in the year, not reassembled in March.
Five regulators, three continents, one question. The convergence isn’t coordinated, which is what makes it significant — it’s what regulators independently arrive at once narrative reporting stops being enough. The estates that will find the next assurance cycle straightforward are the ones already treating source, timestamp, method and assumption as the unit of reporting. Everyone else will discover, one figure at a time, that the number itself is now the thing being audited.