Why ESG Disclosure Is Quietly Becoming a Machine-Readable Asset Class
For most of the last decade, building sustainability data lived in a quiet corner of the annual report. A handful of figures, signed off, lightly checked, rarely contested.
That arrangement is ending. Four shifts are converging on a single outcome: ESG disclosures are becoming machine-readable artefacts, scored and cross-checked at scale.
The buildings underneath those disclosures will be priced accordingly. The question for facility managers is whether their data layer can answer a model’s questions, not just an auditor’s.

Digital twins are going live, and compliance becomes continuous
The shift from static reporting to live operational telemetry is the first signal. Browser-native digital twins now plug straight into CO₂, PM2.5, VOC and humidity feeds, layered onto a 3D model of the asset.
Compliance against the WELL Building Standard stops being a snapshot taken on inspection day. It becomes a continuous question, answered minute by minute.
A building can be WELL-aligned in April and breaching CO₂ thresholds for three hours every afternoon by October. Only continuous, sensor-grade data will surface that gap before a tenant complaint or an auditor does.
This matters because the underlying frameworks were always written with continuous performance in mind. The industry simply lacked the data layer to honour them. That excuse is gone.

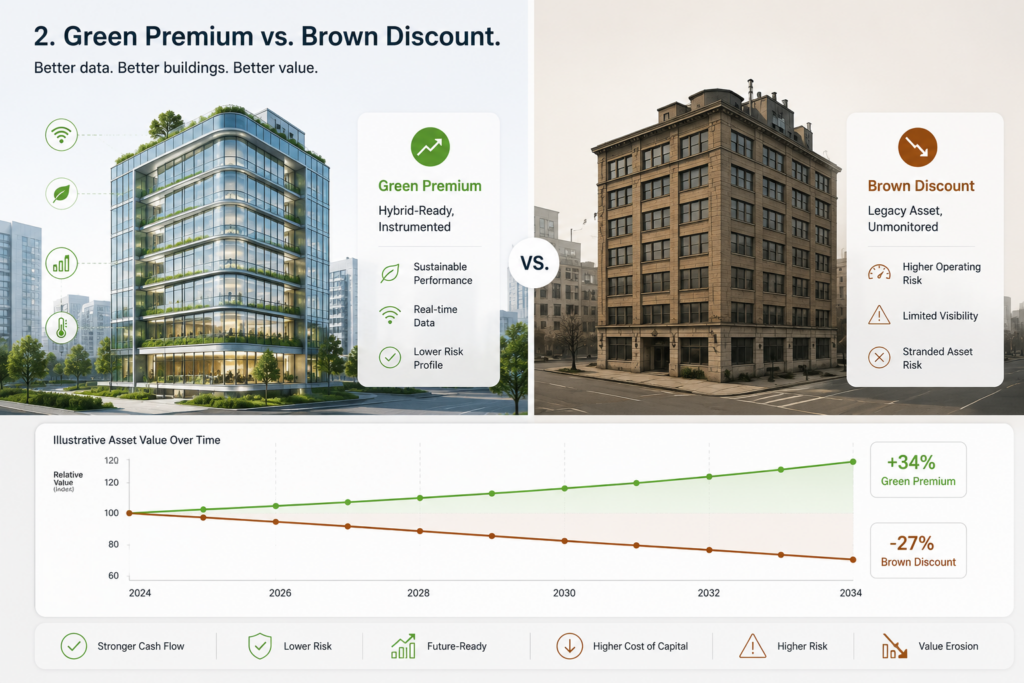
The brown discount has a name and a price tag
The second signal is valuation. Major brokers including JLL and Knight Frank now report meaningful rental premiums for instrumented, hybrid-ready offices, with figures varying by market but consistently in the high single to low double digits.
The inverse is the brown discount: unmonitored legacy assets carrying valuation penalties that lenders and investors are increasingly willing to name aloud.
A BREEAM or LEED certificate describes design intent at a single moment. Valuations, refinancing terms and tenant negotiations are now defended with operational data covering the whole reporting period.
The burden of proof has shifted from the auditor to the owner. “We had a good year” is no longer a sufficient answer when the counterparty has live data from comparable assets.

Natural language processing is reading the reports
The third signal is on the regulatory side. Exchanges and supervisors are piloting language models that parse CSRD disclosures, GRESB submissions and TCFD reports, then compare them across peers and prior years.
Estimated Scope 2 figures, carried-forward IAQ commitments and vaguely worded retrofit pledges are exactly the line items those pipelines flag for follow-up.
The practical effect is a sharp narrowing of the gap between what a report claims and what the building does. Self-reported narrative without operational evidence becomes a risk flag rather than a clean disclosure.
For facility managers, the operational implication is uncomfortable but clear: the document your CFO signs is no longer the last word. It is the input to another model’s review.

Central banks are joining the same workflow
The fourth signal closes the loop. Central bank supervisory work, including pilots referenced under Project Gaia at the BIS Innovation Hub, uses large language models and retrieval-augmented generation to extract climate risk indicators from unstructured corporate filings.
The output is an institutional vulnerability score that informs how lenders are themselves supervised. A bank’s exposure to your portfolio is read by a model that has already digested every prospectus the portfolio sits inside.
This is the mechanism by which the brown discount stops being a soft signal and becomes a refinancing cost. Buildings retrofitted after the threshold lands will pay the difference in basis points.
The sequence is straightforward: live operational data feeds disclosures, NLP pipelines audit those disclosures, supervisory models price the resulting risk.
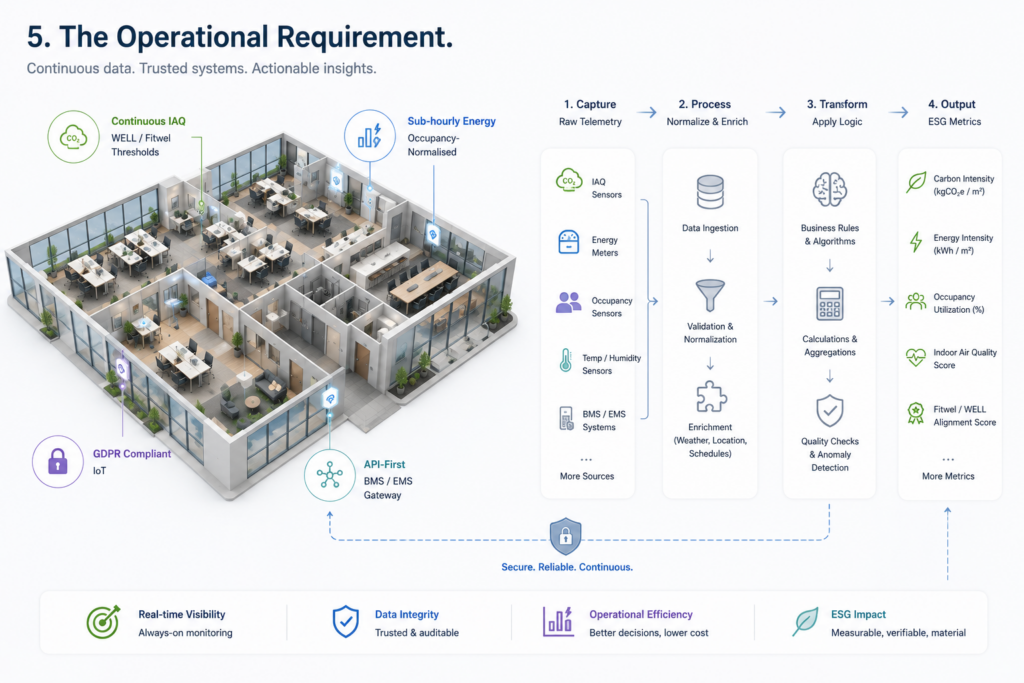
What the operational requirement actually looks like
Strip the abstraction away and the requirement is specific. Continuous IAQ monitoring measured against WELL and Fitwel thresholds. Sub-hourly energy data tied to actual occupancy, not nominal floor area. API-first delivery into whichever reporting framework the next auditor asks for.
None of that is exotic. Sensor packages compliant with GDPR and the relevant building standards now deploy in under an hour over LTE, feeding any BMS or EMS through open protocols.
Tools like DIREK‘s D-XPERT illustrate that the synthesis is feasible today: agentic AI sitting on top of sensor-grade data, queryable in plain English by the people who actually run the building.
The technical pieces are not the bottleneck. The bottleneck is whether a portfolio’s data layer is being scoped this reporting cycle or the next one.
The four signals are not separate stories. They are one workflow in which operational data, disclosure, audit and capital pricing finally meet on the same machine-readable surface.
The question worth sitting with is narrow and answerable: can your portfolio produce machine-readable IAQ and energy-per-occupied-hour today, and if not, which building would you instrument first?